DMM
2-BM has a double crystal multi-layer monochromator (DMM) to change energy. The beamline x-ray energy change is managed by the energy cli python library.
Login into 2bmb@arcturus then:
[2bmb@arcturus,42,~]$ bash
[2bmb@arcturus,42,~]$ energy set --mode Mono --energy-value 20
for help:
energy -h
More detailed instructions are here the energy cli
Technical information about the DMM are available at the links below:
Station |
Description |
Images |
Info |
|---|---|---|---|
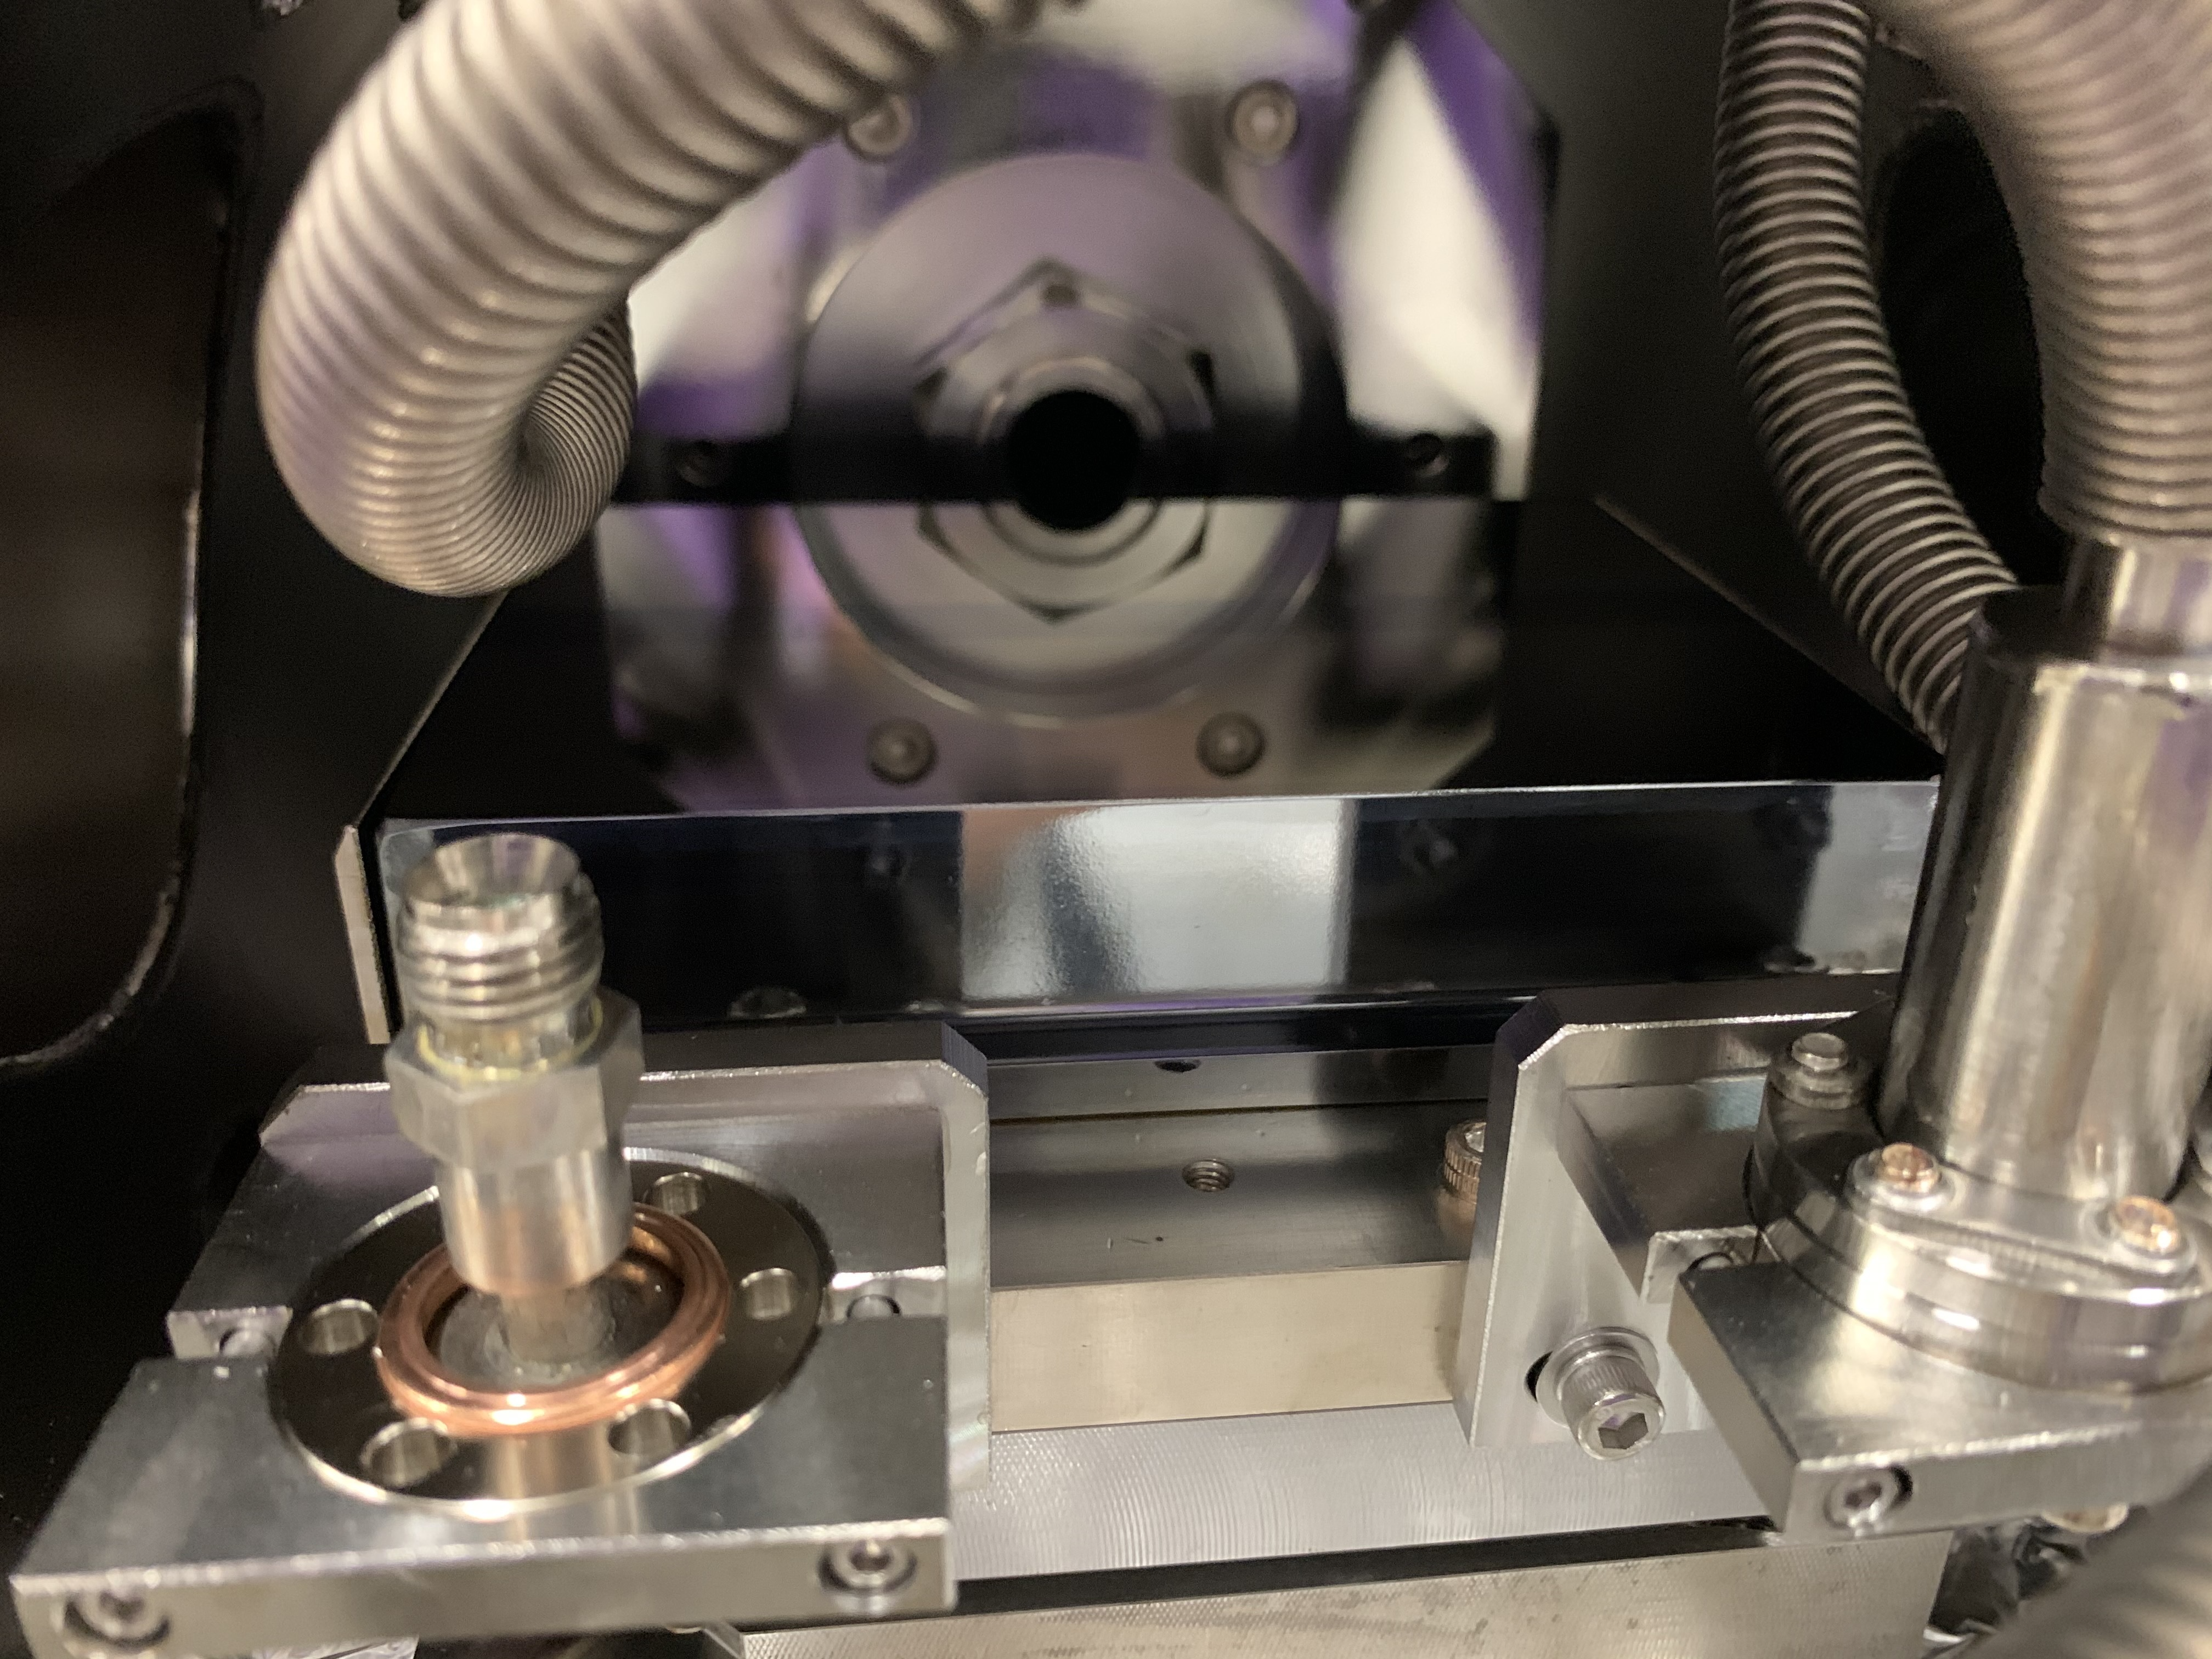
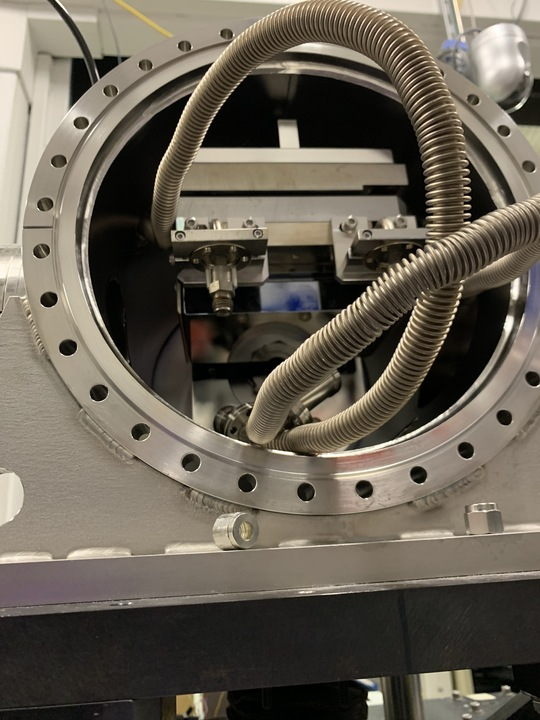
2-BM-A |
DMM |
|
Substrate Specifications (Si <100>)
Parameter |
Value |
|---|---|
Material |
Si <100> flat |
Quantity |
2 pieces |
Dimensions |
145.57 × 101.60 × 34.04 mm³ ± 0.25 mm |
Optical Surface |
140 × 92 mm² |
Spherical Radius |
> 20 km |
Meridional Slope Error |
1.0 µrad (rms) |
Sagittal Slope Error |
1.0 µrad (rms) |
Microroughness |
≤ 0.3 nm (rms) HSFR |
HSFR Spatial Sampling |
0.004–1 µm |
Manufacturing Note |
Grooves per ANL drawing “X2-230001-00” (28 Jan 1998) |
Coating Specifications (W–B₄C Multilayer)
Parameter |
Value |
|---|---|
Coating Type |
W–B₄C multilayer on Si substrate |
Adhesion Layer |
5 nm Cr |
Stripe Dimension |
140 × 44 mm² |
Distance Between Stripes |
4 mm |
Multilayer Period |
13.8 Å and 24 Å ± <1% |
Interface Roughness |
2–3 Å rms |
Number of Layer Pairs |
200 / 150 |
Gamma (Γ) |
0.5 |
Stripe-Free Multilayer
This section collects all information related to the Stripe-Free Multilayer project.
Reference documents
The documents below describe the 2-BM beamline layout before and after the APS-U upgrade, and are used as the geometric reference for the Stripe-Free Multilayer design.
A342-RT1000-00 LAY.pdf — pre-APS-U beamline layout and ray-tracing drawing.
02-BM Beamline Component Reference Table.docx — pre-APS-U component reference table listing the elements along the beamline and their distances from the source.
APSU_FDR_Summary_2-BM.docx — APS-U Final Design Review summary for 2-BM. The new bending-magnet source is repositioned so that components sit 1822 mm farther from the source than in the original lattice. To keep the existing enclosures usable, the beamline centerline is rotated 1.35 mrad inboard around the new source and offset 42.295 mm inboard laterally relative to the original APS lattice BM centerline, accepting a 2.7 mrad fan (1.85 mrad through the front end).
Post APS-U component Z positions
Z is measured along the beam direction from the center of the straight section. Post APS-U values are obtained from the pre APS-U Z (component reference table) plus the +1822 mm source repositioning specified in the FDR summary.
Component |
Post APS-U Z [mm] |
|---|---|
27626.2 |
|
DMM — first mirror |
29335.2 |
DMM — second mirror |
29934.2 |
Vertical intensity modulation
This section quantifies the vertical intensity modulation currently observed in the monochromatic beam delivered downstream of M1 + DMM. The modulation is the main motivation for the Stripe-Free Multilayer project: it shows up as horizontal bands in the projection images and as ring/streak artifacts in the reconstructed volumes.
Two distinct contributions can be separated by the choice of exposure time:
A slow, stationary modulation from the M1 mirror (figure error / coating), best characterised with the long-exposure
flats_01dataset.A fast, moving stripe pattern from the DMM (residual W–B₄C stripe structure), best characterised with the short-exposure, high-rate
S11-AHU505_1000frms_99fps_001.h5stream, which freezes the motion.
Measurement setup
The flat fields used for this analysis are the white fields collected during the
Flat Field Stability Measurement (flats_01, Feb 22, 2026),
available via
Globus (flats_01).
File-naming convention: flat_2x_2bin3.45um_momo20keV_NNNN.tif (4710 frames in 471
sets of 10, one set every 60 s over ~8 hours).
The beamline (energy, M1, DMM) and the imaging chain (scintillator, objective, effective
pixel size) match the Vibration Frequency Measurement used earlier;
what differs in flats_01 is the detector ROI (2048 × 1536 px instead of 1024 × 1024),
the exposure time (0.1 s instead of 0.009999 s), and the cadence/format (10 frames every
60 s saved as TIFFs, rather than a continuous 99 fps HDF5 stream). The values below
reflect the flats_01 configuration.
Item |
Value |
|---|---|
X-ray energy |
20.0 keV |
Monochromator |
2-BM-A double multilayer monochromator |
DMM upstream arm angle ( |
0.72579 ° (≈ 12.668 mrad) |
DMM downstream arm angle ( |
0.73808 ° (≈ 12.882 mrad) |
Mirror (M1) |
2-BM Mirror, Pt stripe |
M1 grazing-incidence angle |
0.15 ° (≈ 2.618 mrad) |
Scintillator |
LuAG, 50 µm active thickness |
Objective magnification / tube length |
2.0× / 1.0 mm |
Camera |
FLIR Oryx ORX-10G-51S5M (s/n 19173710) |
Camera pixel size (sensor) |
3.45 µm |
Effective image pixel size |
3.45 µm (1.725 µm native × 2× binning) |
ROI (X × Y) / binning |
2048 × 1536 px / 2× binning |
Field of view at detector (H × V) |
≈ 7.07 × 5.30 mm |
Exposure time |
0.1 s |
Acquisition cadence |
10 frames / set, 1 set every 60 s, ~8 h total |
Flat-field source files |
|
Detector Z from source (post APS-U) |
≈ 54000 mm (54 m) |
Distance DMM 2nd mirror → detector |
≈ 24066 mm (54000 − 29934.2) |
Quantitative metrics (mirror contribution, flats_01)
The following metrics are computed from a vertical line profile through a single
flats_01 frame, averaged horizontally over the usable beam width. They characterise
the mirror-induced modulation only; the DMM stripe contribution is averaged out by
the 0.1 s exposure (see next subsection).
Metric |
Value |
|---|---|
Peak-to-valley modulation [%] |
35.7 |
RMS modulation [%] |
7.0 |
Dominant vertical period [µm] |
≈ 130 |
Number of visible bands across beam |
33 (in the ~3.5 mm analysis window) |
Stability over time (drift) [%/h] |
to be filled in |
Modulation is defined as:
computed on the flat-field profile after dark subtraction and normalization to the slowly varying envelope (low-pass filtered profile), so that only the high-frequency stripe contribution is retained.
Mirror-induced modulation (from flats_01)
The flats_01 exposures average out the fast DMM stripe motion (0.1 s exposure
covers many cycles of the moving DMM pattern, see next subsection) and therefore
reveal mainly the slowly varying, stationary modulation that originates at the M1
mirror. The ~130 µm vertical period quantified below is attributed to figure error
on M1, not to the DMM coating.

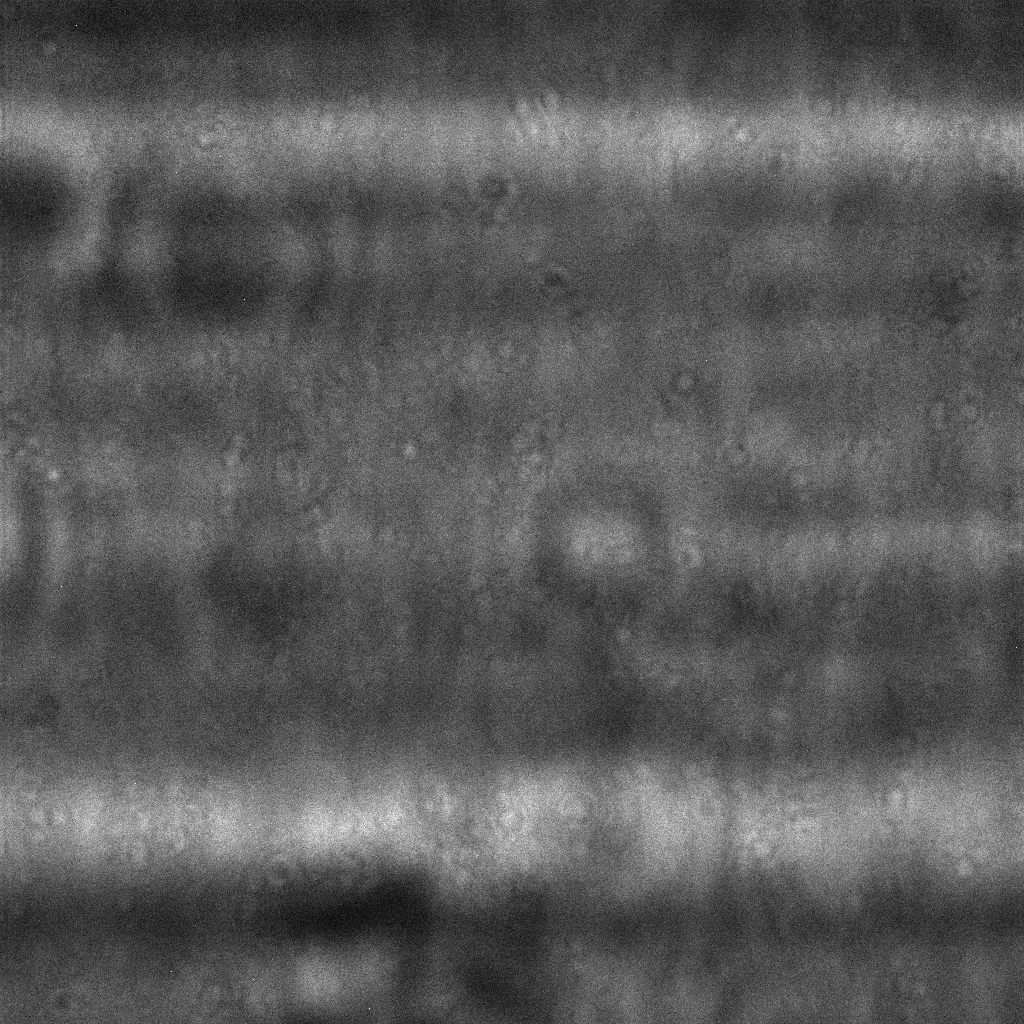
Reference flat-field image from the flats_01 dataset
(flat_2x_2bin3.45um_momo20keV_0001). The smooth horizontal banding visible here
is the mirror contribution; the much faster DMM stripes are averaged out by the
0.1 s exposure.
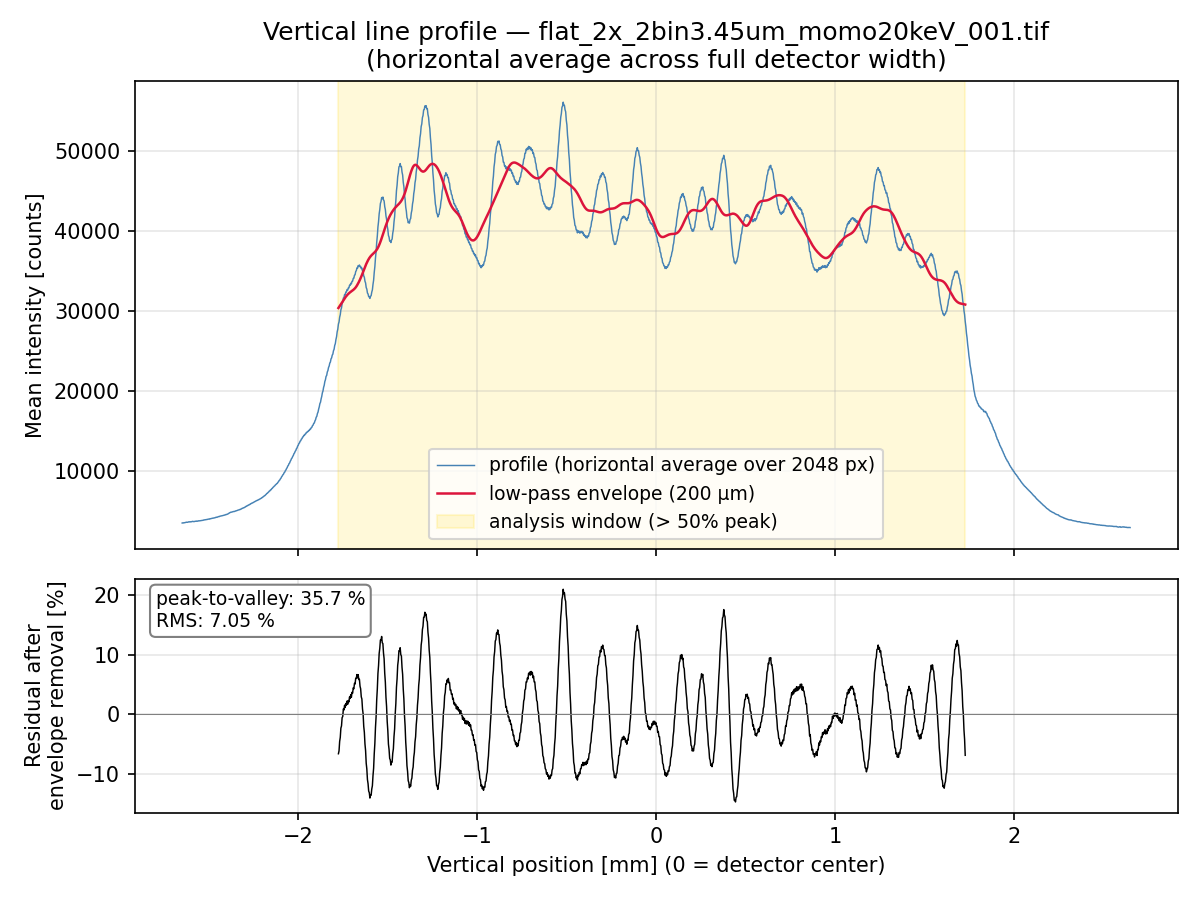
Vertical line profile obtained from
flat_2x_2bin3.45um_momo20keV_001.tif by averaging horizontally across the full
2048-pixel detector width. Top: raw profile (blue) with the low-pass envelope
(red, 200 µm moving average) overlaid; the yellow band marks the analysis window
where the beam intensity exceeds 50 % of its peak (~3.5 mm vertical extent).
Bottom: residual after envelope removal — the high-frequency mirror contribution
isolated by \((I - I_\mathrm{env}) / I_\mathrm{env}\). From this profile the
peak-to-valley modulation is 35.7 % and the RMS modulation is 7.0 %, with
a dominant vertical period of ≈ 130 µm (≈ 33 bright bands across the
illuminated window).
DMM-induced stripes (from S11-AHU505_1000frms_99fps_001.h5)
The DMM contribution sits on top of the mirror-induced modulation and is best
seen in the short-exposure, high-rate stream of the
Vibration Frequency Measurement — file
S11-AHU505_1000frms_99fps_001.h5 (1000 frames at 99 fps, 0.009999 s exposure),
available via
Globus (test_20251219_APS_PVs).
Played back as a movie, the horizontal stripes shift vertically and rapidly
frame-to-frame — a clear fingerprint of the DMM (the mirror pattern is static).
Single frame extracted from S11-AHU505_1000frms_99fps_001.h5 (one of the 1000
frames stored in the HDF5 file), representative of the DMM-induced horizontal
stripes. Two stripe periodicities are visible: a fine spacing of ~83 px between
adjacent bright stripes, and a coarser envelope with spacing of ~700 px between
the strongest bands.
Two characteristic vertical spacings can be measured on the DMM stripe pattern (detector effective pixel size = 3.45 µm):
Feature |
Distance [px] |
Distance [µm] |
|---|---|---|
Fine spacing (adjacent stripes) |
≈ 83 |
≈ 286 |
Coarse spacing (envelope of strong bands) |
≈ 700 |
≈ 2415 (≈ 2.4 mm) |
Substrate correction specification
An engineering analysis of the substrate height power-spectral-density
(PSD) has been produced as the basis for a substrate-improvement
specification: 2-BM Multilayer Substrate Stripe-Reduction Specification.
The report derives the mirror-surface height and slope tolerances that
would produce <2% RMS detector-intensity variation, and compares the
measured PSD from the S11-AHU505_1000frms_99fps_001.h5 dataset
(the same acquisition characterised in the Vertical intensity
modulation subsection above) against that target.
The analysis uses the geometry documented in this page: grazing
angle 12.882 mrad, source-to-optic distance p = 29.9342 m,
optic-to-detector distance q = 24.0658 m, point-source
magnification M = (p+q)/p = 1.804, a 3.45 µm detector pixel, and
a 12 µm RMS vertical source producing a 9.647 µm RMS Gaussian blur
at the detector plane.
Main findings:
The measured substrate height PSD exceeds the specification required for <2% RMS detector-intensity variation across the mid- to low-spatial-frequency range.
Recommended correction: best-effort broadband ion-beam figuring (IBF) over mirror-surface periods from 8.1 mm to the full mirror length (145 mm).
Overall measured height RMS on the current substrate is 6.9 nm. Corresponding total-band targets are 3.11 nm (5% intensity-RMS target), 1.24 nm (2%), and 0.62 nm (1%).
Two spectral maxima in the PSD sit at mirror periods of 14.50 mm and 48.33 mm, but these are maxima within predefined search bands rather than deterministic narrow spectral lines. The data support broadband correction, not cancellation of two discrete sinusoidal periods.
Both a geometric ray-density model and a Fresnel wavefront- propagation calculation are given in the report; the two agree closely for mirror periods above ~8 mm and diverge only at the shortest periods where diffraction dominates.
Analytic single-frequency height and slope tolerances at the two identified spectral maxima (excerpted from Section 3 of the report):
Mirror period (mm) |
Intensity RMS target |
Height RMS limit (nm) |
Slope RMS limit (nrad) |
|---|---|---|---|
14.50 |
2% |
0.053 |
22.8 |
48.33 |
2% |
0.565 |
73.4 |
Full derivation, the analytic single-frequency model, the measured PSD plot with 1% / 2% / 5% envelopes overlaid, and the height/slope tolerance curves across the full mirror-period range are in the report.